Note
Go to the end to download the full example code
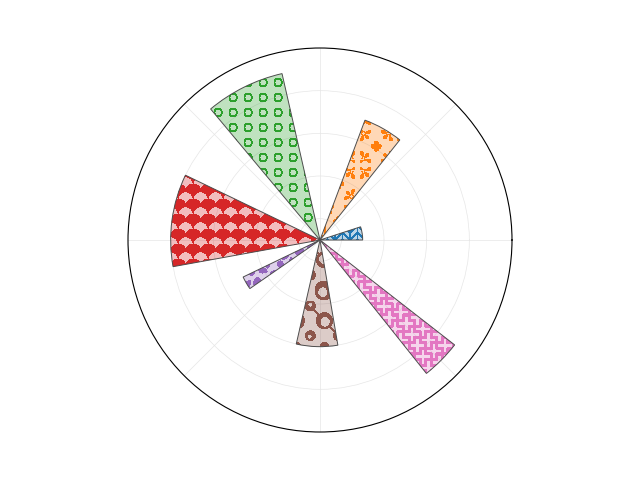
Pie chart used Matplotlib logo, with patterns
A bar chart with patterns, pattern colors are set explicitly.
# pie chart used in matplotlib logo

# We start with a pie chart that resembles the the one in the matplotlib logo.
# The only change is their facecolors.


import numpy as np
import matplotlib.pyplot as plt
from matplotlib.patches import Rectangle
import matplotlib.cm as cm

fig = plt.figure(1)
fig.clf()

ax_position = [0.1, 0.1, 0.8, 0.8]

lw_bars=0.7
lw_grid=0.5
lw_border=1

rgrid=[1, 3, 5, 7]

ax = fig.add_axes(ax_position, projection='polar')
ax.set_axisbelow(True)

N = 7
arc = 2. * np.pi
theta = np.arange(0.0, arc, arc / N)
radii = np.array([2, 6, 8, 7, 4, 5, 8])
width = np.pi / 4 * np.array([0.4, 0.4, 0.6, 0.8, 0.2, 0.5, 0.3])
bars = ax.bar(theta, radii, width=width, bottom=0.0, align='edge',
              edgecolor='0.3', lw=lw_bars)
for i, bar in enumerate(bars):
    bar.set_facecolor(f"C{i}")

ax.tick_params(labelbottom=False, labeltop=False,
               labelleft=False, labelright=False)

ax.grid(lw=lw_grid, color='0.9')
ax.set_rmax(9)
ax.set_yticks(rgrid)

# the actual visible background - extends a bit beyond the axis
ax.add_patch(Rectangle((0, 0), arc, 9.58,
                       facecolor='white', zorder=0,
                       clip_on=False, in_layout=False))


# We now apply patterns from the pattern_monster.

import mpl_visual_context.patheffects as pe
from mpl_pe_pattern_monster import PatternMonster

pm = PatternMonster()

# names of patterns. These patterns only accept a single color.
pattern_names = ["herringbone-2" , "flower-3", "circles-3", "scales-2",
                 "leaves-4", "circles-8", "plus-6"]

for p, slug in zip(ax.patches, pattern_names):
    pattern_fill = pm.get(slug).fill(ax, color_cycle=[None])
    # None in color_cycle will use facecorlor of the parent artist.
    path_effects = [
        pe.GCModify(alpha=0.3) | pe.FillOnly(),  # We fill the pie with the
                                                 # facecolor with alpha=0.3
        pattern_fill  # Then we fill the area with patterns.
    ]
    p.set_path_effects(path_effects)

plt.show()
Total running time of the script: (0 minutes 0.140 seconds)